Search Analytics
Search Analytics gives you a clear picture of how customers are using the search bar in your store. You can see which keywords are driving orders, where searches are failing, and exactly where in the world those gaps are happening.
Search Analytics provides insights into what customers are searching for on your ordering website or app and what happens after they perform a search. They help you fix gaps and improve search performance.
Instead of only showing how many searches were made, Search Analytics helps you understand the complete journey from a customer's search query to search results, actions, cart additions, checkout, and successful orders.
Accessing Search Analytics
To access Search Analytics:
Log in to the Admin Panel and navigate to the Analytics section. Open Search Analytics. The analytics dashboard displays data for the selected date range
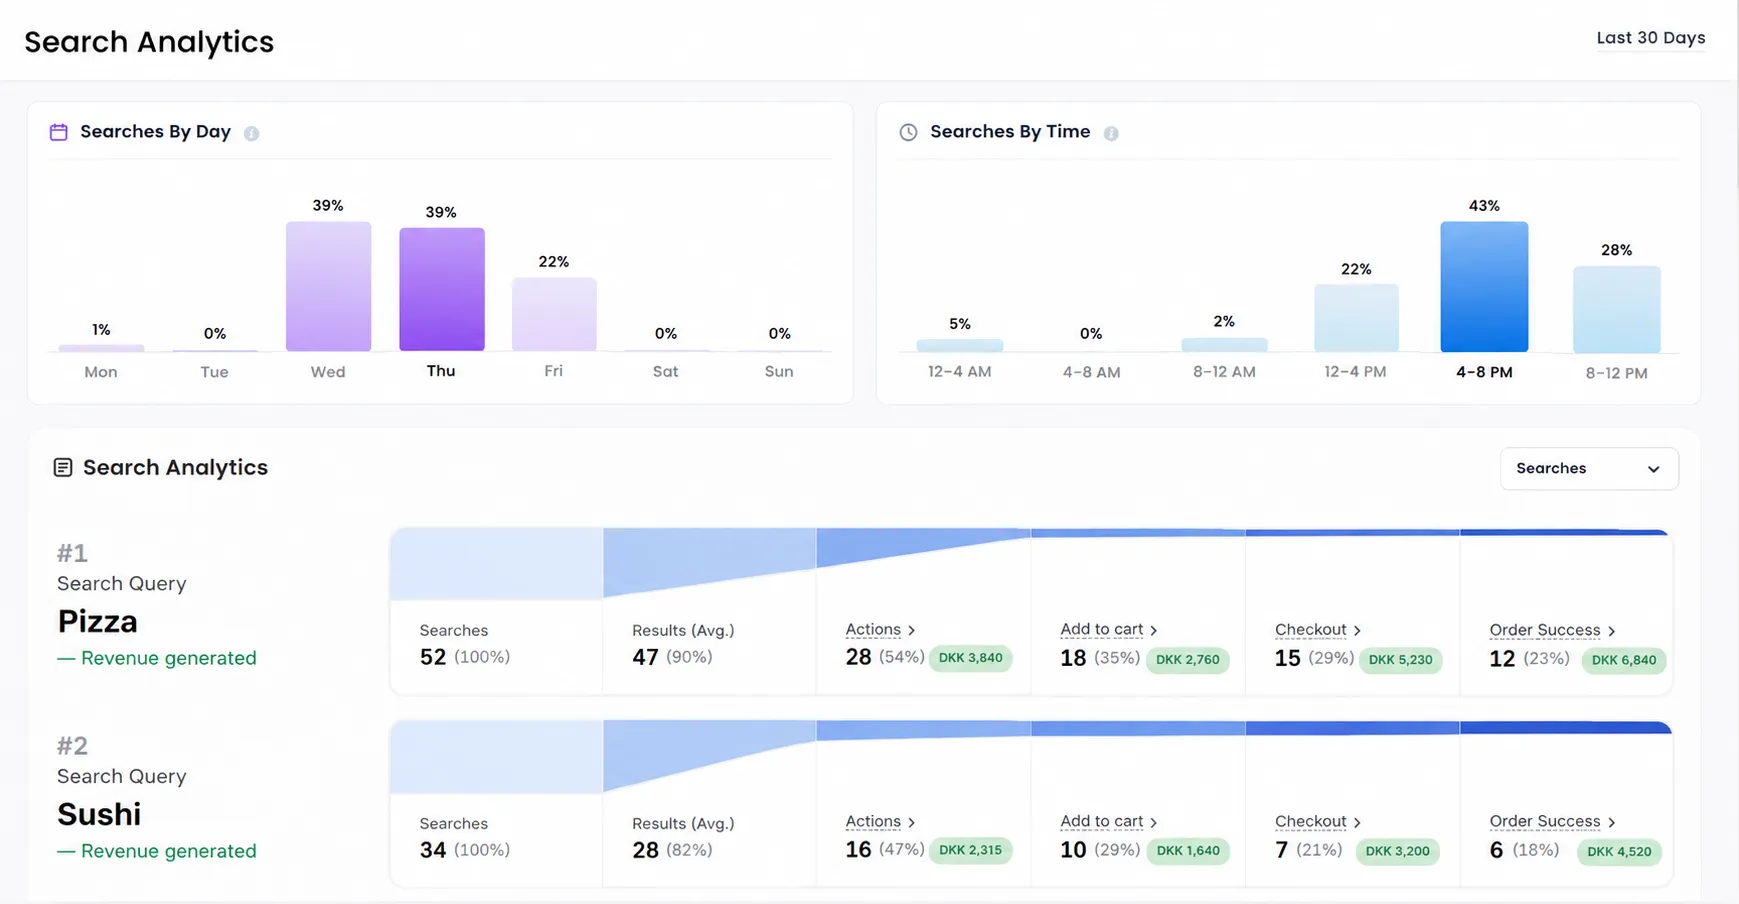
Searches By Day
The Searches By Day chart shows the percentage of searches performed on each day of the week. This helps you identify which days receive the highest search activity.
Searches By Time
The Searches By Time chart shows when customers are performing searches throughout the day. This helps you understand when customers are most likely to search for products.
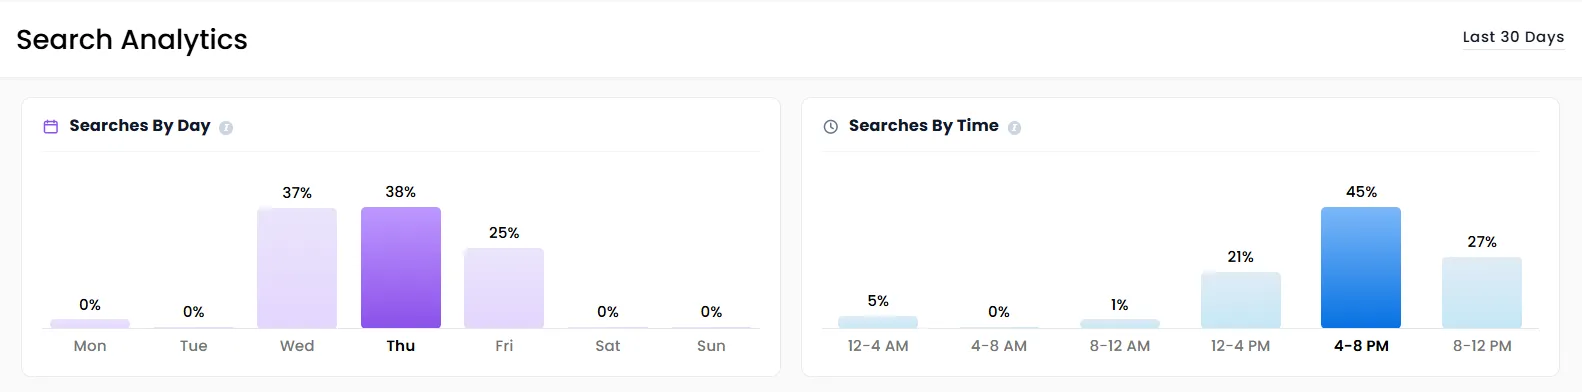
Search Analytics
The Search Analytics section provides a detailed view of individual search queries and tracks what customers do after searching.
The Search Analytics section includes a dropdown that lets you switch between key metrics, including Searches, Results (Avg.), Actions, Add to Cart, Checkout, and Order Success, allowing you to analyze each stage of the search-to-order journey.
The Keyword Funnel Leaderboard ranks every search query by how well it converts from the first search all the way through to a completed order. Each row shows one keyword and its full funnel performance across six stages
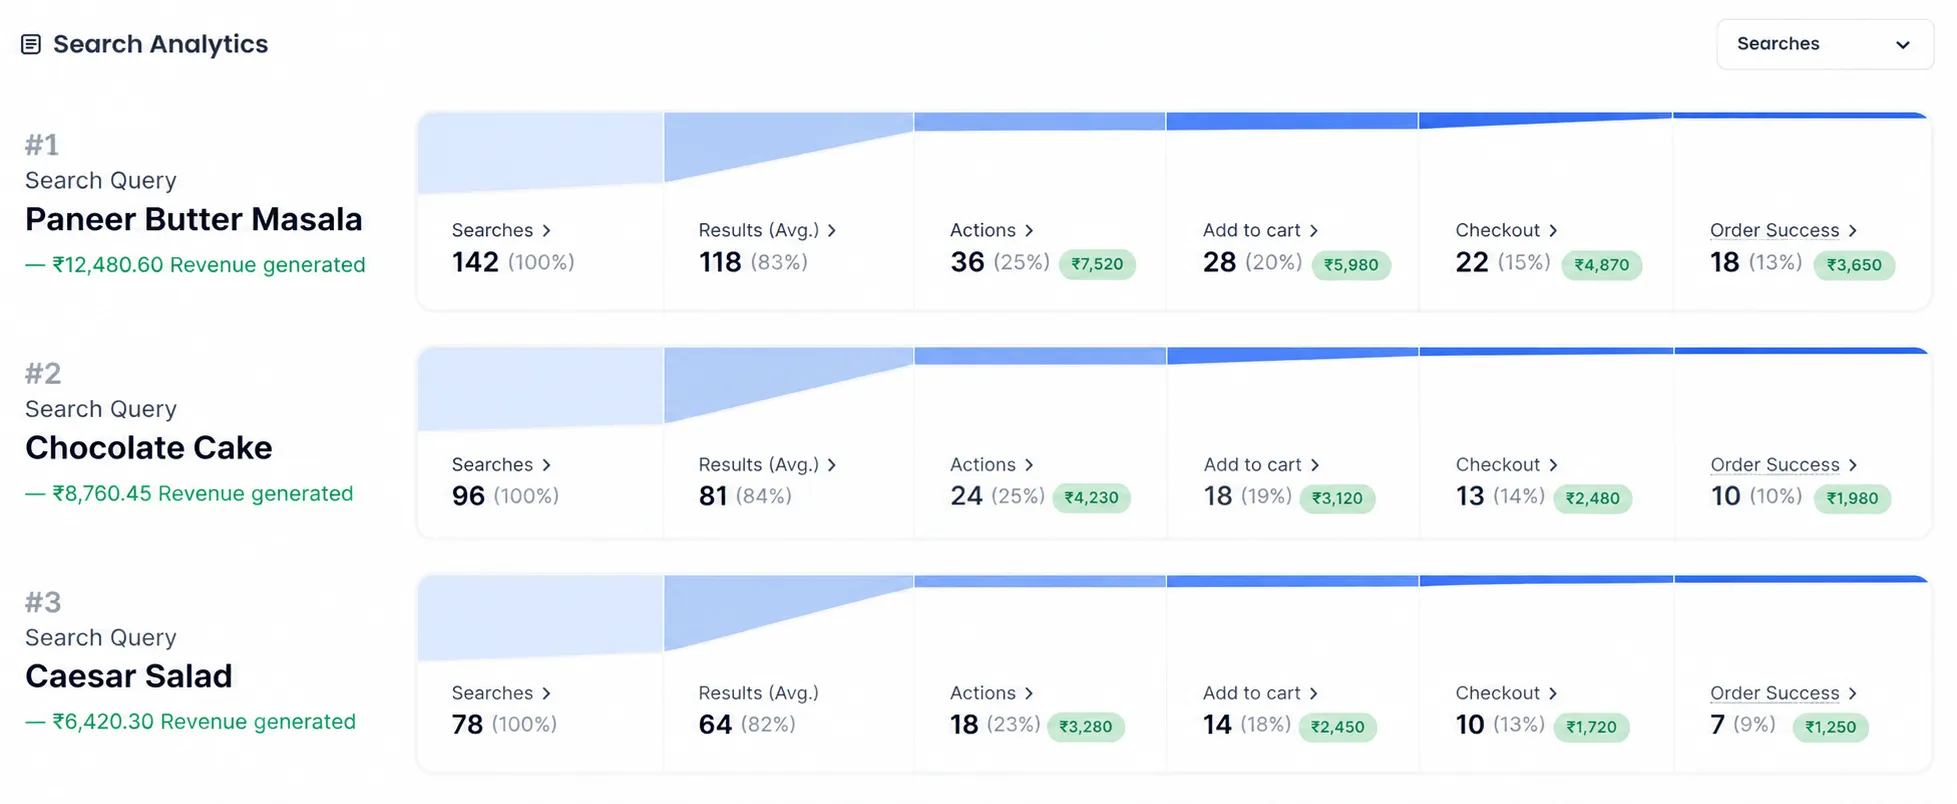
Search Query
Each entry represents a specific term or phrase searched by customers. The search query represents exactly what customers are looking for. Example: If "Pizza" appears frequently, this tells you that customers are actively searching for the Pizza item.
Searches
The Searches metric shows how many times customers searched for a particular query.
For example: Pizza — 52 Searches. This means the query "Pizza" was searched 52 times during the selected period.
Results (Avg.)
Results (Avg.) shows the average number of results returned for a search query. Example: Suppose customers search for "Coffee" 50 times, but the average number of results is only 1. This may be worth investigating to determine whether additional coffee products should be added or whether existing product names/categories need improvement.
The percentage shown is how many users were shown this number of average results
Actions
The Actions metric shows customer interactions after performing a search. Actions help you understand whether customers are interacting with the results after searching.
A search may receive many searches but generate very few actions. This can indicate that customers are not finding the results relevant enough to continue. The value shown is the estimated amount generated via the actions.
Add to Cart
The Add to Cart metric shows how many customers added a product to their cart after searching. This helps identify searches that are successfully moving customers from search > product discovery > cart, with the associated amount being shown with that event
Checkout
The Checkout metric shows how many search journeys progressed to checkout.
For example: Pizza — Checkout: 1 (25%) — $149 This indicates that one of the search journeys progressed to checkout, with the corresponding value displayed.
Order Success
The Order Success metric shows when a search journey ultimately results in a successful order. This allows you to identify search queries that are contributing directly to completed purchases.
For example: If customers frequently search for "Pizza" and those searches regularly result in successful orders, you can identify Pizza as a strong search-to-order product category.
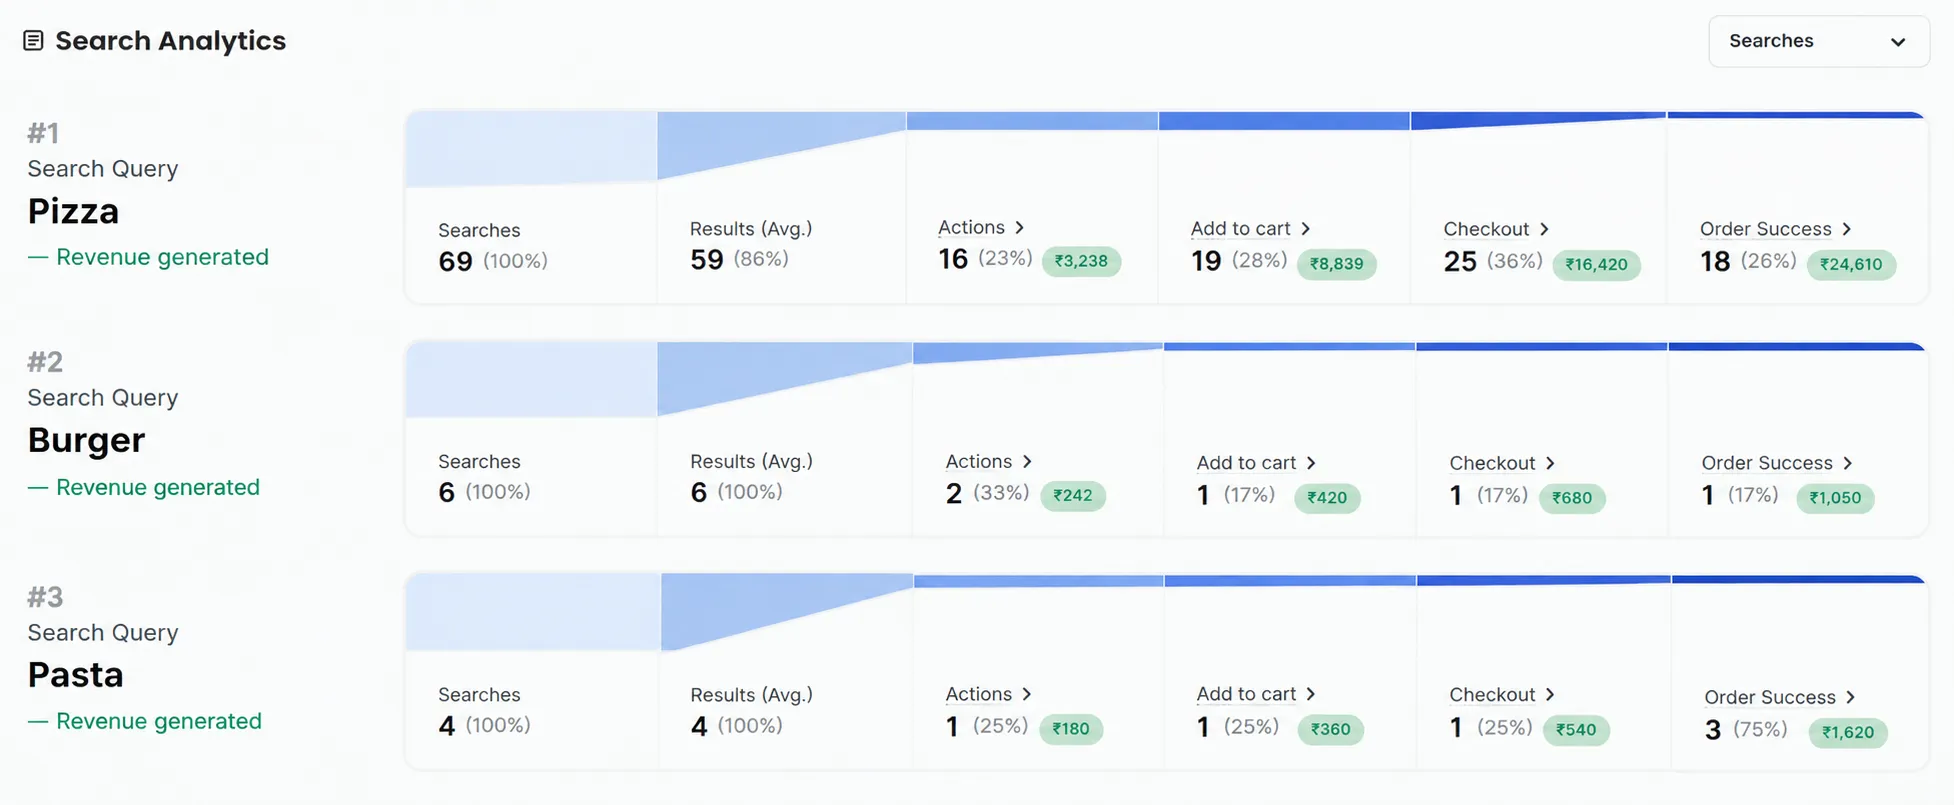
Changing the Analytics Metric
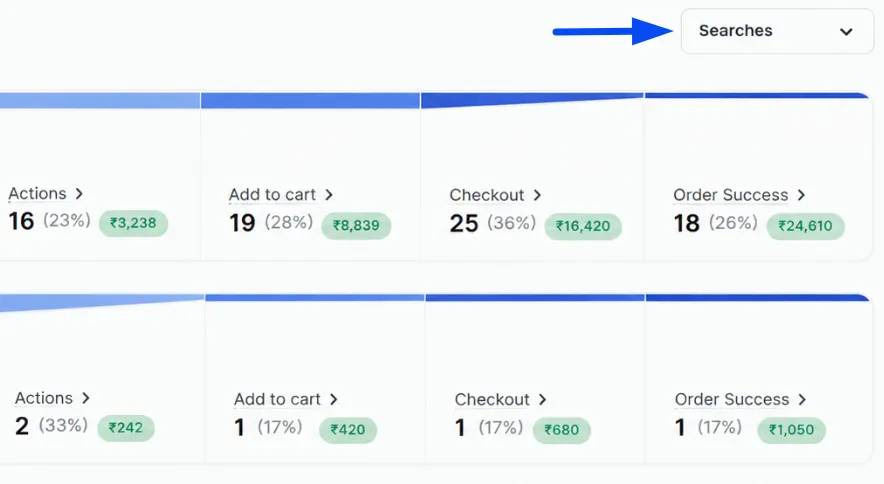
The dropdown in the Search Analytics section allows you to change the metric displayed for the search queries.
Example: If you want to identify the most frequently searched products, select Searches, or if you want to identify which searches resulted in completed purchases, select Order Success.
Viewing a Search Keyword in Detail
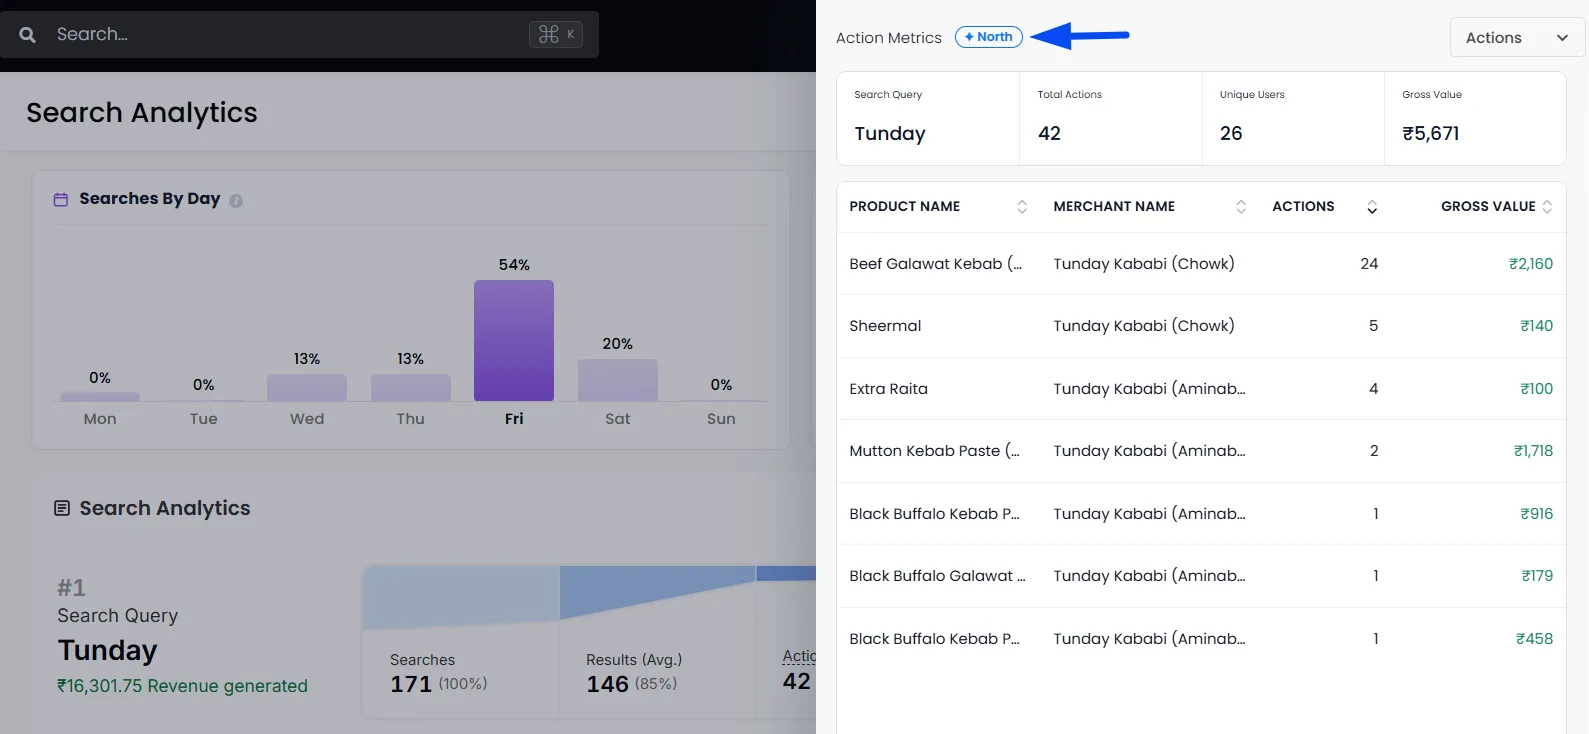
Click any search query in the Search Analytics section to view more detailed information about the customer activity associated with that search.
The detailed view provides a deeper breakdown of the selected query, including actions, unique users, gross value, products, merchants, and customer locations.
Action Metrics
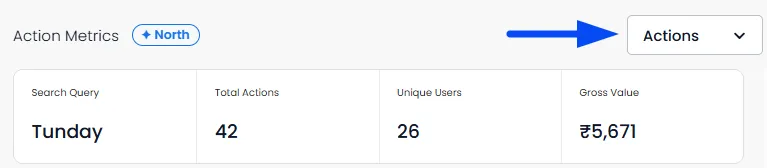
The detailed panel provides a quick summary of the selected search query, including Total Actions, Unique Users, and Gross Value.
Use the dropdown to switch between Actions, Add to Cart, Checkout, and Order Success to analyze different stages of the customer journey.
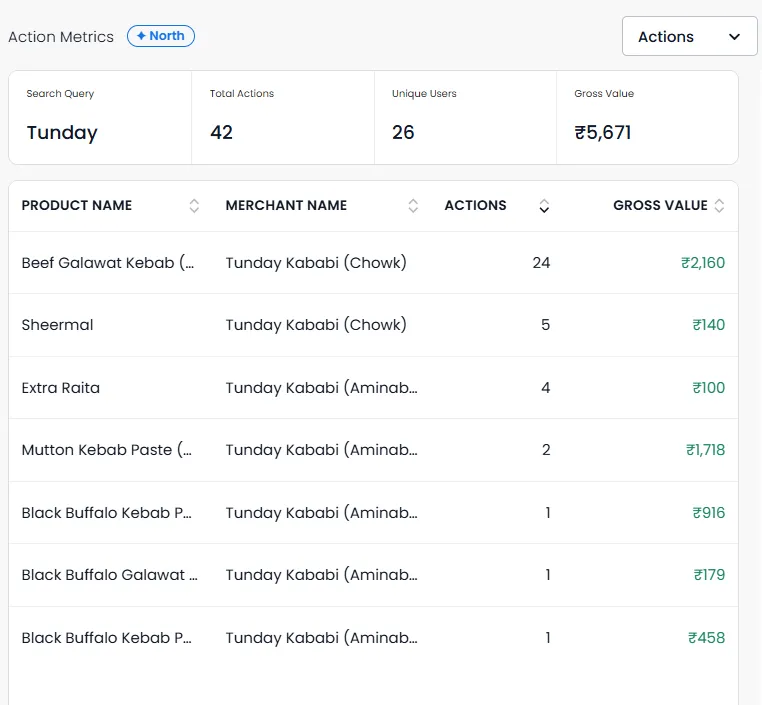
The panel also shows a product-level breakdown with Product Name, Merchant Name, Actions, and Gross Value, helping you identify which products and merchants are driving engagement from the selected search.
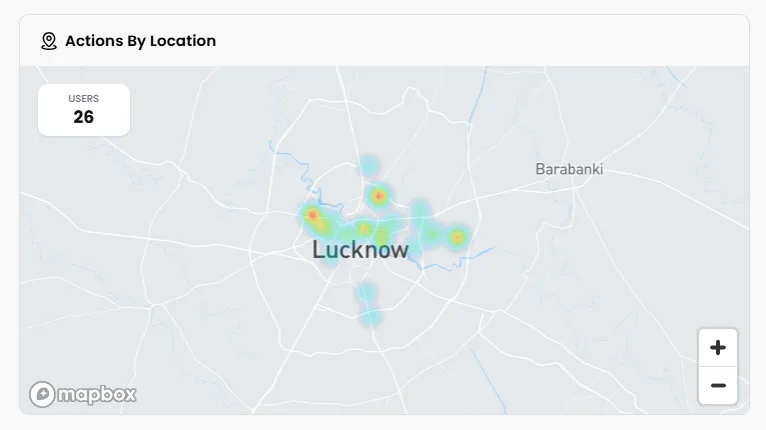
Actions by Location
The search analytics panel also includes an Actions by Location map for each search query.
The map provides a geographical view of where users performed actions related to the selected search query. This can help you understand whether a particular search is generating stronger engagement in specific areas.
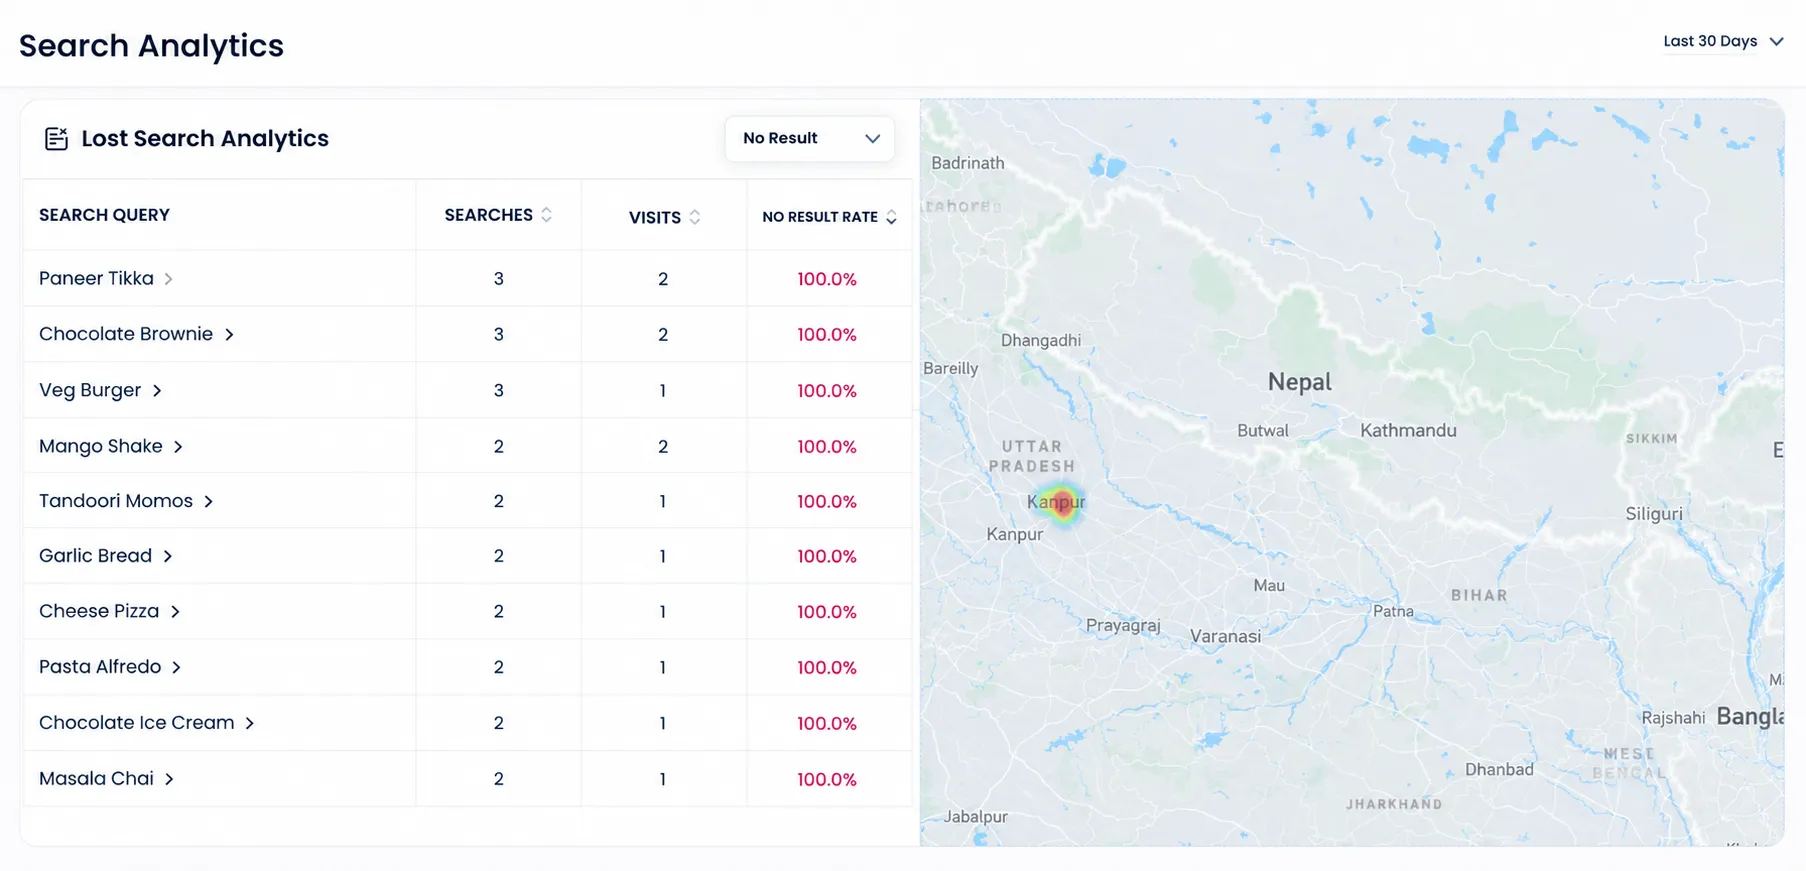
Lost Search Analytics
The Lost Search Analytics table lists every query that returned no useful results. These are missed opportunities for customers who were looking for something your store either doesn't carry, has out of stock, or doesn't name in a way the search engine recognises.
Each row shows:
- Query: The exact term the customer searched
- Search Count: Total number of times this query was searched
- Visits: The number of visits associated with the lost search query. This can help provide additional context around the number of customer visits associated with the searches.
- No-Result Rate: The percentage of searches for this query that returned no results
Filtering Lost Search Analytics
The dropdown at the top of Lost Search Analytics allows you to filter searches based on the type or number of results returned.
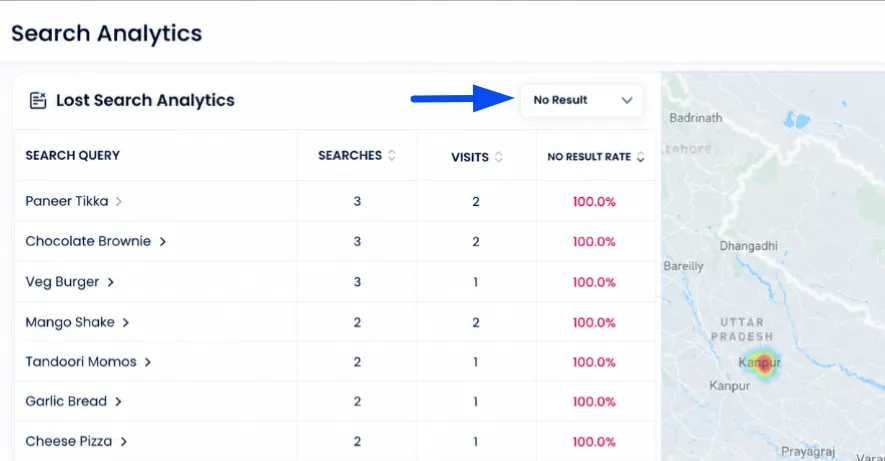
Lost Searches by No Result
Select No Result to identify searches where customers received no matching results.
Example: If customers search for "Vegan Pizza" and there are no matching products, the query can appear under the No Result filter.
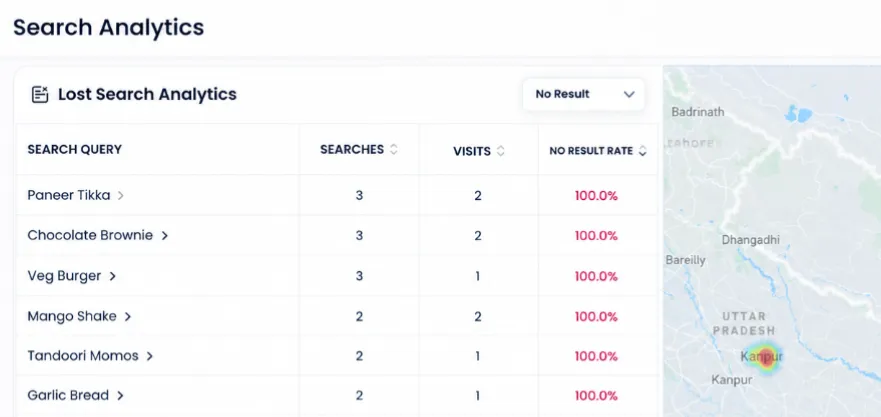
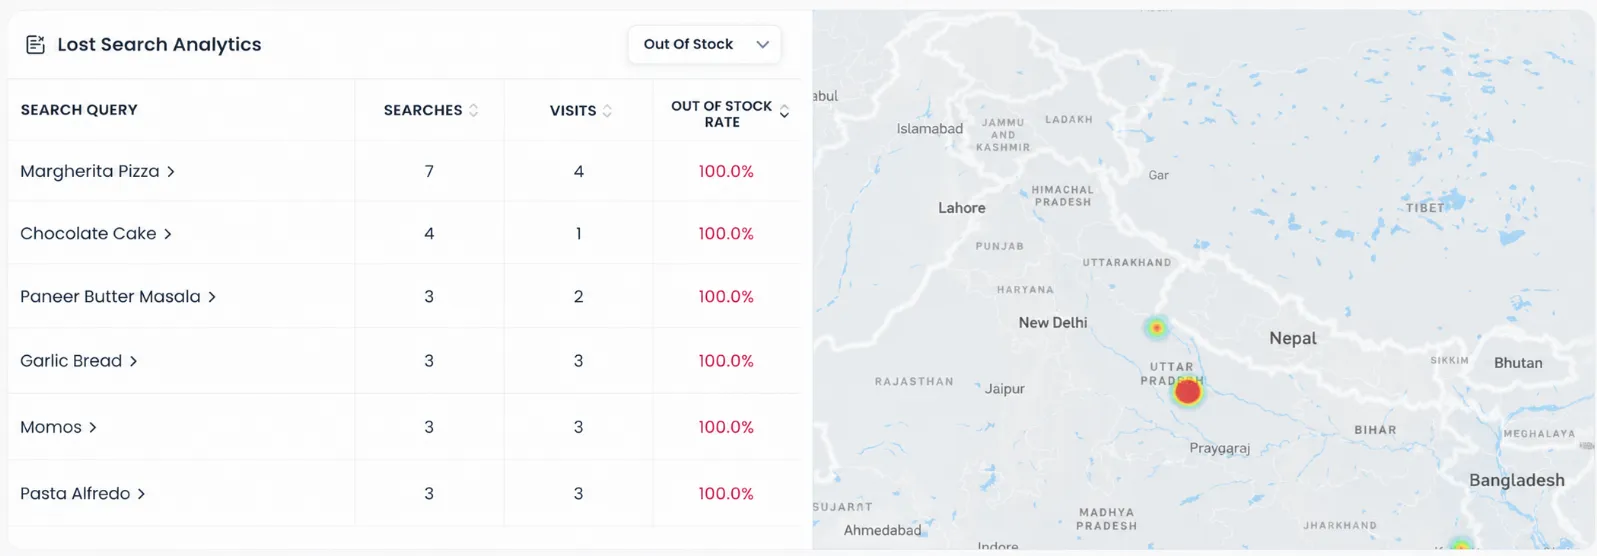
Lost Searches by Out Of Stock
Select Out Of Stock to identify searches where relevant products are unavailable because they are out of stock. Example: Suppose customers frequently search for "Chocolate Cake," but the available matching product is out of stock.
This filter can help identify demand that may be lost because of inventory availability.
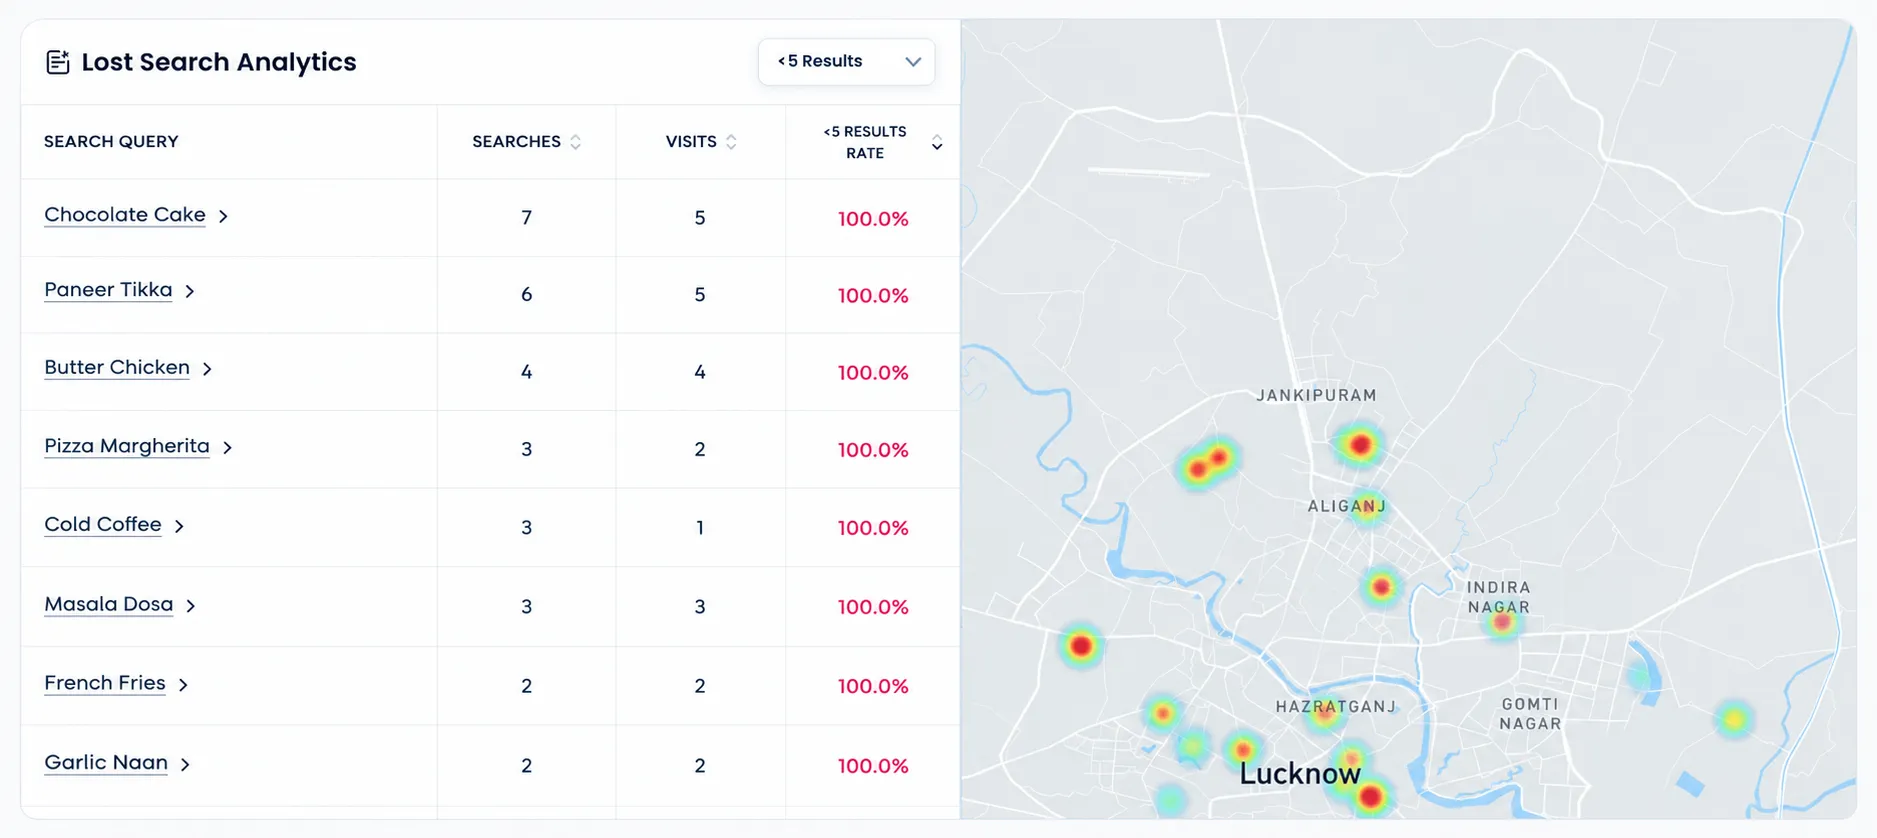
Less Than 5 Results
Select <5 Results to identify search queries that return fewer than five results.
Example: If customers search for "Burger" and the search returns only two products, the query can be identified using this filter.
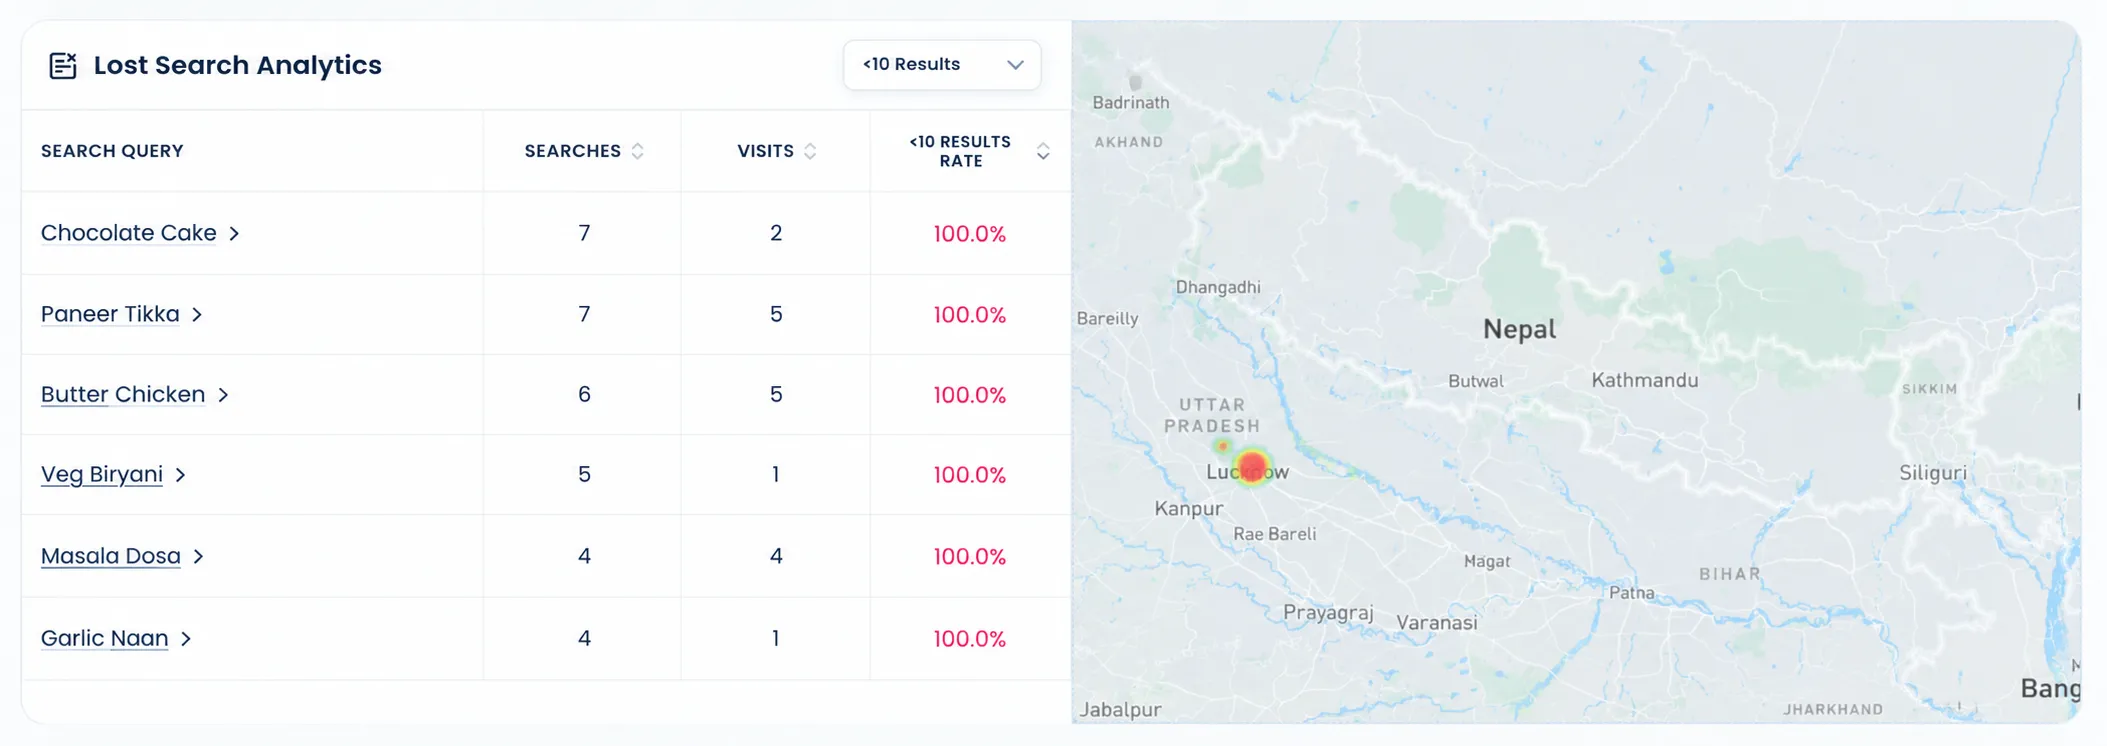
Less Than 10 Results
Select <10 Results to identify searches returning fewer than ten results. This provides a broader view of searches where customers have a relatively limited number of matching products.
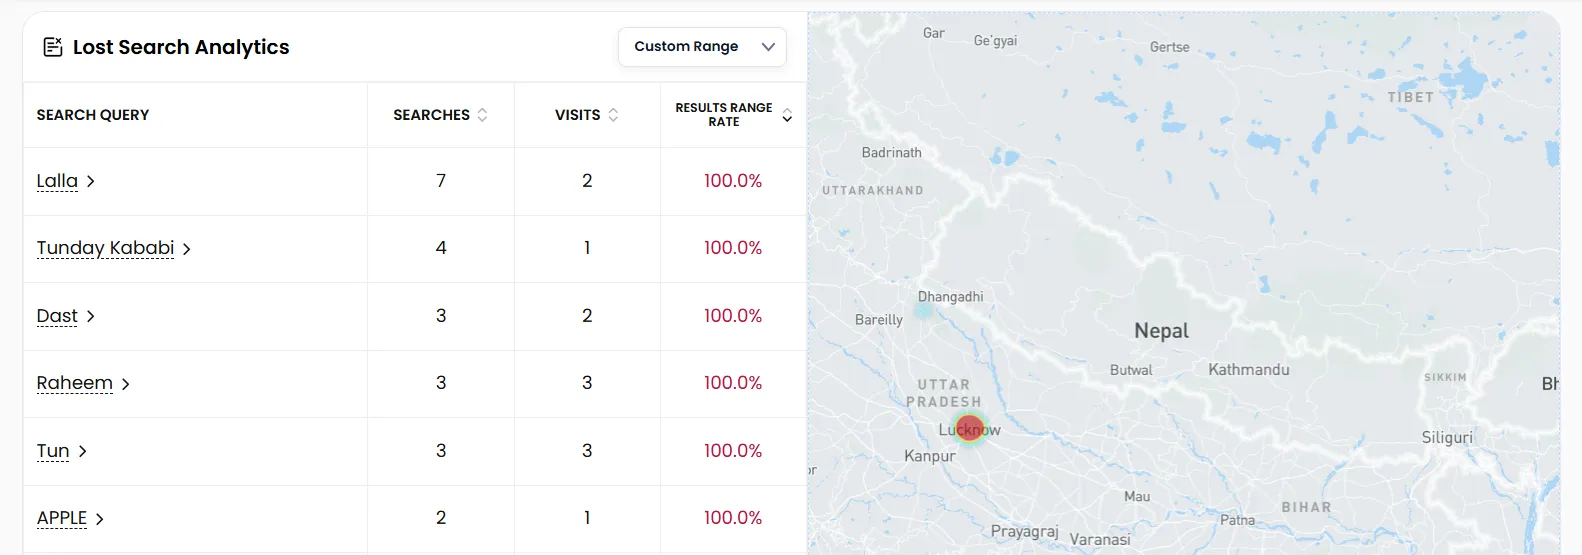
Custom Range
Use Custom Range when you want to define your own result threshold.
This can be useful when a business has a specific target for the minimum number of search results it expects customers to receive.
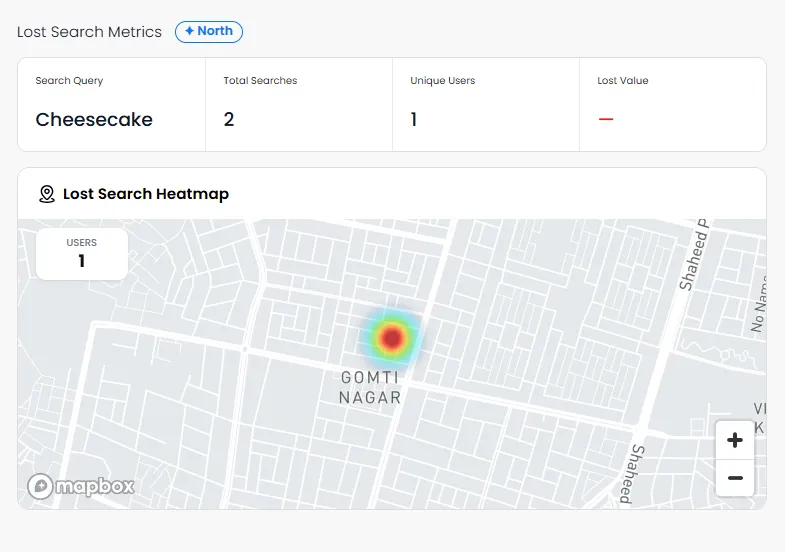
Viewing a Lost Search on the Map
- Click on any query row in the Lost Search table.
- A map view opens showing the geographic distribution of where this search originated.
- Use this map to identify whether failed searches are concentrated in a specific city, neighbourhood, or delivery zone.
Best Practices
- Start with your highest-traffic lost searches. Sort the Lost Search table by Search Count descending to find the queries where the most customers are hitting a dead end. These represent the biggest immediate opportunities.
- Use the keyword detail heatmap to understand regional demand. If a high-performing keyword is clustered in one area, consider whether you're fully stocked and visible for that location.
- Compare Searches vs Orders in the funnel. A large gap between Searches and Results means the query isn't matching any products a naming or tagging issue. A large gap between Clicks and Cart Adds means the product page isn't converting; a content or pricing issue.
- Look beyond zero-result queries. Use the Under 5 Results filter to find searches that technically return something but so little that customers likely left unsatisfied.